
Original analysis
2026 Take-Home Pay by State: Compare $50K, $75K and $100K Salaries
Compare modeled 2026 take-home pay across all 50 states at $50,000, $75,000, and $100,000 salaries using one documented single-filer scenario.
Estimate, not personalized tax advice. Results use one simplified state-level wage scenario. Local income taxes, most state payroll programs, tax credits, benefits, itemized deductions, and household-specific rules can materially change a real paycheck or return.
At a glance
- Coverage
- 50 states; Washington, D.C. shown separately
- Salary levels
- $50,000, $75,000, and $100,000
- Baseline
- Single filer, no dependents, standard deduction
- Dataset rows
- 150 state-salary rows plus 3 D.C. rows
Key findings
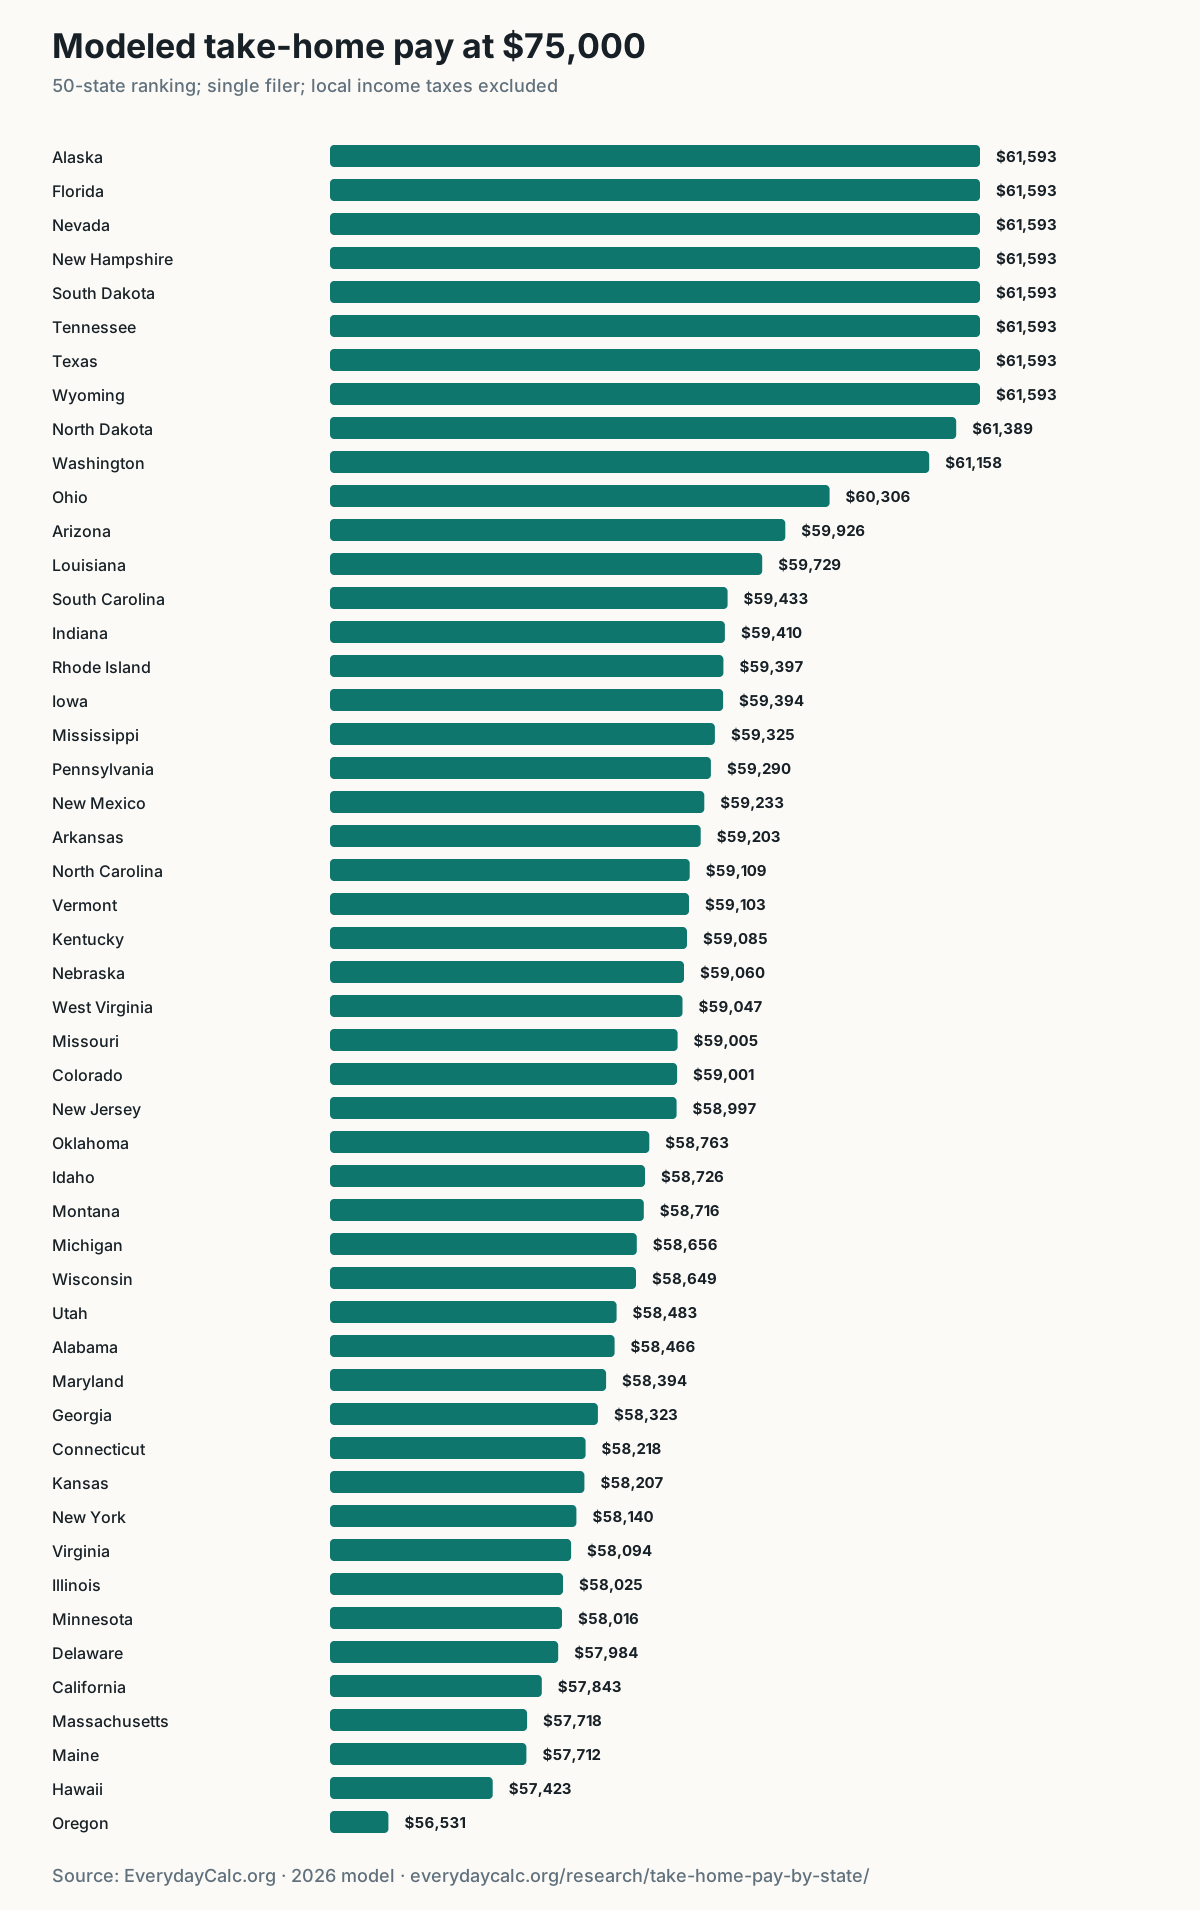
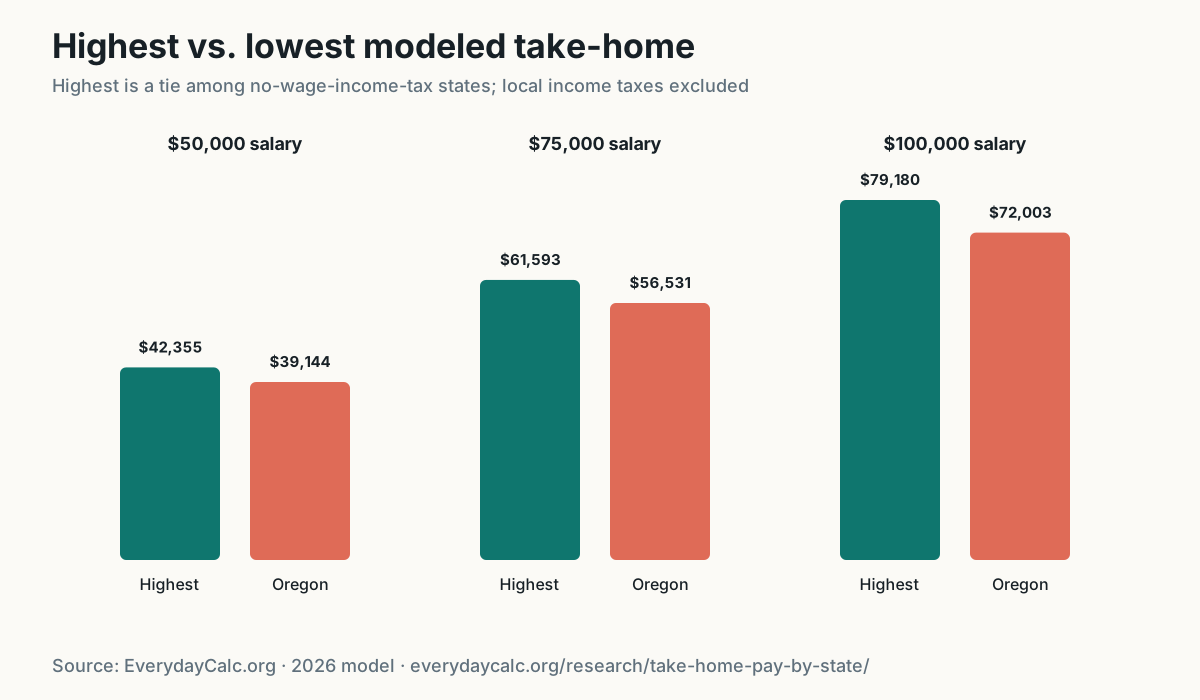
- Alaska, Florida, Nevada, New Hampshire, South Dakota, Tennessee, Texas, Wyoming tie for the highest modeled take-home at $75,000: $61,593 before local income taxes.
- Oregon has the lowest modeled take-home at $75,000 in this scenario: $56,531.
- The modeled spread at $75,000 is $5,062; it grows from $3,211 at $50,000 to $7,177 at $100,000.
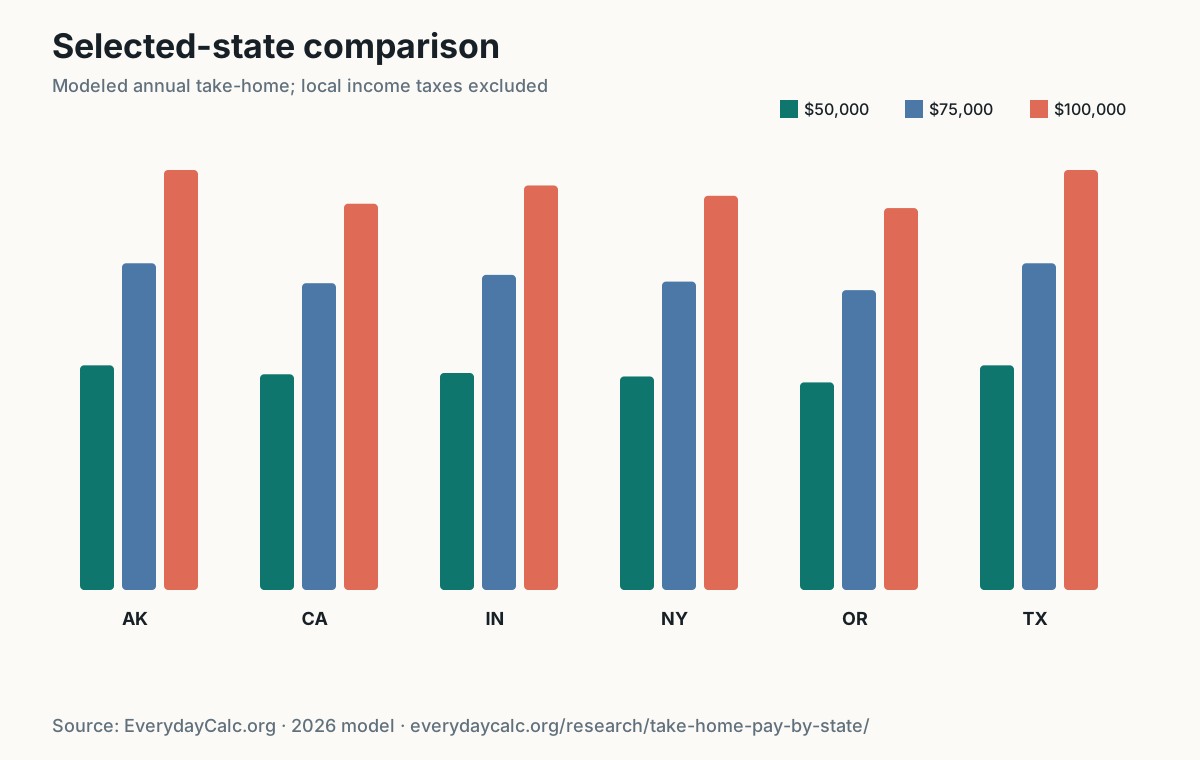
- Indiana is 15 at $75,000 with $59,410 modeled annual take-home, excluding county income tax.
- The median modeled state take-home at $75,000 is $59,053.
Choose a salary
The selection changes the visible table without creating separate indexable URLs.
$50,000 salary ranking
Scroll horizontally for all columns. Activate a column heading to sort this table.
| T-1 | Alaska | $50,000 | $3,820 | $3,825 | $0 | $42,355 | $3,530 | $1,629 | 15.3% |
|---|---|---|---|---|---|---|---|---|---|
| T-1 | Florida | $50,000 | $3,820 | $3,825 | $0 | $42,355 | $3,530 | $1,629 | 15.3% |
| T-1 | Nevada | $50,000 | $3,820 | $3,825 | $0 | $42,355 | $3,530 | $1,629 | 15.3% |
| T-1 | New Hampshire | $50,000 | $3,820 | $3,825 | $0 | $42,355 | $3,530 | $1,629 | 15.3% |
| T-1 | North Dakota | $50,000 | $3,820 | $3,825 | $0 | $42,355 | $3,530 | $1,629 | 15.3% |
| T-1 | South Dakota | $50,000 | $3,820 | $3,825 | $0 | $42,355 | $3,530 | $1,629 | 15.3% |
| T-1 | Tennessee | $50,000 | $3,820 | $3,825 | $0 | $42,355 | $3,530 | $1,629 | 15.3% |
| T-1 | Texas | $50,000 | $3,820 | $3,825 | $0 | $42,355 | $3,530 | $1,629 | 15.3% |
| T-1 | Wyoming | $50,000 | $3,820 | $3,825 | $0 | $42,355 | $3,530 | $1,629 | 15.3% |
| 10 | Washington | $50,000 | $3,820 | $3,825 | $0 | $42,065 | $3,505 | $1,618 | 15.9% |
| 11 | Ohio | $50,000 | $3,820 | $3,825 | $600 | $41,756 | $3,480 | $1,606 | 16.5% |
| 12 | South Carolina | $50,000 | $3,820 | $3,825 | $858 | $41,498 | $3,458 | $1,596 | 17.0% |
| 13 | Arizona | $50,000 | $3,820 | $3,825 | $1,041 | $41,314 | $3,443 | $1,589 | 17.4% |
| 14 | Louisiana | $50,000 | $3,820 | $3,825 | $1,114 | $41,241 | $3,437 | $1,586 | 17.5% |
| 15 | New Mexico | $50,000 | $3,820 | $3,825 | $1,184 | $41,171 | $3,431 | $1,583 | 17.7% |
| 16 | New Jersey | $50,000 | $3,820 | $3,825 | $1,215 | $41,140 | $3,428 | $1,582 | 17.7% |
| 17 | Vermont | $50,000 | $3,820 | $3,825 | $1,241 | $41,114 | $3,426 | $1,581 | 17.8% |
| 18 | Iowa | $50,000 | $3,820 | $3,825 | $1,248 | $41,107 | $3,426 | $1,581 | 17.8% |
| 19 | Rhode Island | $50,000 | $3,820 | $3,825 | $1,258 | $41,097 | $3,425 | $1,581 | 17.8% |
| 20 | Mississippi | $50,000 | $3,820 | $3,825 | $1,268 | $41,087 | $3,424 | $1,580 | 17.8% |
| 21 | Nebraska | $50,000 | $3,820 | $3,825 | $1,395 | $40,960 | $3,413 | $1,575 | 18.1% |
| 22 | Missouri | $50,000 | $3,820 | $3,825 | $1,413 | $40,942 | $3,412 | $1,575 | 18.1% |
| 23 | Arkansas | $50,000 | $3,820 | $3,825 | $1,415 | $40,940 | $3,412 | $1,575 | 18.1% |
| 24 | West Virginia | $50,000 | $3,820 | $3,825 | $1,444 | $40,911 | $3,409 | $1,574 | 18.2% |
| 25 | Indiana | $50,000 | $3,820 | $3,825 | $1,446 | $40,910 | $3,409 | $1,573 | 18.2% |
| 26 | North Carolina | $50,000 | $3,820 | $3,825 | $1,486 | $40,869 | $3,406 | $1,572 | 18.3% |
| 27 | Colorado | $50,000 | $3,820 | $3,825 | $1,492 | $40,863 | $3,405 | $1,572 | 18.3% |
| 28 | Pennsylvania | $50,000 | $3,820 | $3,825 | $1,535 | $40,820 | $3,402 | $1,570 | 18.4% |
| 29 | Idaho | $50,000 | $3,820 | $3,825 | $1,542 | $40,813 | $3,401 | $1,570 | 18.4% |
| 30 | Wisconsin | $50,000 | $3,820 | $3,825 | $1,577 | $40,778 | $3,398 | $1,568 | 18.4% |
| 31 | Montana | $50,000 | $3,820 | $3,825 | $1,593 | $40,762 | $3,397 | $1,568 | 18.5% |
| 32 | Kentucky | $50,000 | $3,820 | $3,825 | $1,632 | $40,723 | $3,394 | $1,566 | 18.6% |
| 33 | Utah | $50,000 | $3,820 | $3,825 | $1,672 | $40,683 | $3,390 | $1,565 | 18.6% |
| 34 | California | $50,000 | $3,820 | $3,825 | $1,040 | $40,665 | $3,389 | $1,564 | 18.7% |
| 35 | Oklahoma | $50,000 | $3,820 | $3,825 | $1,705 | $40,651 | $3,388 | $1,563 | 18.7% |
| 36 | Michigan | $50,000 | $3,820 | $3,825 | $1,874 | $40,481 | $3,373 | $1,557 | 19.0% |
| 37 | Minnesota | $50,000 | $3,820 | $3,825 | $1,877 | $40,478 | $3,373 | $1,557 | 19.0% |
| 38 | Georgia | $50,000 | $3,820 | $3,825 | $1,972 | $40,383 | $3,365 | $1,553 | 19.2% |
| 39 | Kansas | $50,000 | $3,820 | $3,825 | $1,990 | $40,365 | $3,364 | $1,552 | 19.3% |
| 40 | Connecticut | $50,000 | $3,820 | $3,825 | $2,000 | $40,355 | $3,363 | $1,552 | 19.3% |
| 41 | Maryland | $50,000 | $3,820 | $3,825 | $2,011 | $40,344 | $3,362 | $1,552 | 19.3% |
| 42 | Virginia | $50,000 | $3,820 | $3,825 | $2,061 | $40,294 | $3,358 | $1,550 | 19.4% |
| 43 | Alabama | $50,000 | $3,820 | $3,825 | $2,069 | $40,286 | $3,357 | $1,549 | 19.4% |
| 44 | Delaware | $50,000 | $3,820 | $3,825 | $2,098 | $40,257 | $3,355 | $1,548 | 19.5% |
| 45 | New York | $50,000 | $3,820 | $3,825 | $2,103 | $40,252 | $3,354 | $1,548 | 19.5% |
| 46 | Maine | $50,000 | $3,820 | $3,825 | $2,193 | $40,162 | $3,347 | $1,545 | 19.7% |
| 47 | Hawaii | $50,000 | $3,820 | $3,825 | $2,284 | $40,071 | $3,339 | $1,541 | 19.9% |
| 48 | Illinois | $50,000 | $3,820 | $3,825 | $2,330 | $40,025 | $3,335 | $1,539 | 20.0% |
| 49 | Massachusetts | $50,000 | $3,820 | $3,825 | $2,280 | $39,845 | $3,320 | $1,533 | 20.3% |
| 50 | Oregon | $50,000 | $3,820 | $3,825 | $3,211 | $39,144 | $3,262 | $1,506 | 21.7% |
$75,000 salary ranking
Scroll horizontally for all columns. Activate a column heading to sort this table.
| T-1 | Alaska | $75,000 | $7,670 | $5,738 | $0 | $61,593 | $5,133 | $2,369 | 17.9% |
|---|---|---|---|---|---|---|---|---|---|
| T-1 | Florida | $75,000 | $7,670 | $5,738 | $0 | $61,593 | $5,133 | $2,369 | 17.9% |
| T-1 | Nevada | $75,000 | $7,670 | $5,738 | $0 | $61,593 | $5,133 | $2,369 | 17.9% |
| T-1 | New Hampshire | $75,000 | $7,670 | $5,738 | $0 | $61,593 | $5,133 | $2,369 | 17.9% |
| T-1 | South Dakota | $75,000 | $7,670 | $5,738 | $0 | $61,593 | $5,133 | $2,369 | 17.9% |
| T-1 | Tennessee | $75,000 | $7,670 | $5,738 | $0 | $61,593 | $5,133 | $2,369 | 17.9% |
| T-1 | Texas | $75,000 | $7,670 | $5,738 | $0 | $61,593 | $5,133 | $2,369 | 17.9% |
| T-1 | Wyoming | $75,000 | $7,670 | $5,738 | $0 | $61,593 | $5,133 | $2,369 | 17.9% |
| 9 | North Dakota | $75,000 | $7,670 | $5,738 | $203 | $61,389 | $5,116 | $2,361 | 18.1% |
| 10 | Washington | $75,000 | $7,670 | $5,738 | $0 | $61,158 | $5,096 | $2,352 | 18.5% |
| 11 | Ohio | $75,000 | $7,670 | $5,738 | $1,287 | $60,306 | $5,025 | $2,319 | 19.6% |
| 12 | Arizona | $75,000 | $7,670 | $5,738 | $1,666 | $59,926 | $4,994 | $2,305 | 20.1% |
| 13 | Louisiana | $75,000 | $7,670 | $5,738 | $1,864 | $59,729 | $4,977 | $2,297 | 20.4% |
| 14 | South Carolina | $75,000 | $7,670 | $5,738 | $2,160 | $59,433 | $4,953 | $2,286 | 20.8% |
| 15 | Indiana | $75,000 | $7,670 | $5,738 | $2,183 | $59,410 | $4,951 | $2,285 | 20.8% |
| 16 | Rhode Island | $75,000 | $7,670 | $5,738 | $2,196 | $59,397 | $4,950 | $2,285 | 20.8% |
| 17 | Iowa | $75,000 | $7,670 | $5,738 | $2,198 | $59,394 | $4,950 | $2,284 | 20.8% |
| 18 | Mississippi | $75,000 | $7,670 | $5,738 | $2,268 | $59,325 | $4,944 | $2,282 | 20.9% |
| 19 | Pennsylvania | $75,000 | $7,670 | $5,738 | $2,303 | $59,290 | $4,941 | $2,280 | 20.9% |
| 20 | New Mexico | $75,000 | $7,670 | $5,738 | $2,359 | $59,233 | $4,936 | $2,278 | 21.0% |
| 21 | Arkansas | $75,000 | $7,670 | $5,738 | $2,390 | $59,203 | $4,934 | $2,277 | 21.1% |
| 22 | North Carolina | $75,000 | $7,670 | $5,738 | $2,484 | $59,109 | $4,926 | $2,273 | 21.2% |
| 23 | Vermont | $75,000 | $7,670 | $5,738 | $2,490 | $59,103 | $4,925 | $2,273 | 21.2% |
| 24 | Kentucky | $75,000 | $7,670 | $5,738 | $2,507 | $59,085 | $4,924 | $2,273 | 21.2% |
| 25 | Nebraska | $75,000 | $7,670 | $5,738 | $2,533 | $59,060 | $4,922 | $2,272 | 21.3% |
| 26 | West Virginia | $75,000 | $7,670 | $5,738 | $2,546 | $59,047 | $4,921 | $2,271 | 21.3% |
| 27 | Missouri | $75,000 | $7,670 | $5,738 | $2,588 | $59,005 | $4,917 | $2,269 | 21.3% |
| 28 | Colorado | $75,000 | $7,670 | $5,738 | $2,592 | $59,001 | $4,917 | $2,269 | 21.3% |
| 29 | New Jersey | $75,000 | $7,670 | $5,738 | $2,596 | $58,997 | $4,916 | $2,269 | 21.3% |
| 30 | Oklahoma | $75,000 | $7,670 | $5,738 | $2,830 | $58,763 | $4,897 | $2,260 | 21.6% |
| 31 | Idaho | $75,000 | $7,670 | $5,738 | $2,867 | $58,726 | $4,894 | $2,259 | 21.7% |
| 32 | Montana | $75,000 | $7,670 | $5,738 | $2,877 | $58,716 | $4,893 | $2,258 | 21.7% |
| 33 | Michigan | $75,000 | $7,670 | $5,738 | $2,937 | $58,656 | $4,888 | $2,256 | 21.8% |
| 34 | Wisconsin | $75,000 | $7,670 | $5,738 | $2,944 | $58,649 | $4,887 | $2,256 | 21.8% |
| 35 | Utah | $75,000 | $7,670 | $5,738 | $3,110 | $58,483 | $4,874 | $2,249 | 22.0% |
| 36 | Alabama | $75,000 | $7,670 | $5,738 | $3,127 | $58,466 | $4,872 | $2,249 | 22.0% |
| 37 | Maryland | $75,000 | $7,670 | $5,738 | $3,199 | $58,394 | $4,866 | $2,246 | 22.1% |
| 38 | Georgia | $75,000 | $7,670 | $5,738 | $3,270 | $58,323 | $4,860 | $2,243 | 22.2% |
| 39 | Connecticut | $75,000 | $7,670 | $5,738 | $3,375 | $58,218 | $4,851 | $2,239 | 22.4% |
| 40 | Kansas | $75,000 | $7,670 | $5,738 | $3,385 | $58,207 | $4,851 | $2,239 | 22.4% |
| 41 | New York | $75,000 | $7,670 | $5,738 | $3,453 | $58,140 | $4,845 | $2,236 | 22.5% |
| 42 | Virginia | $75,000 | $7,670 | $5,738 | $3,498 | $58,094 | $4,841 | $2,234 | 22.5% |
| 43 | Illinois | $75,000 | $7,670 | $5,738 | $3,568 | $58,025 | $4,835 | $2,232 | 22.6% |
| 44 | Minnesota | $75,000 | $7,670 | $5,738 | $3,577 | $58,016 | $4,835 | $2,231 | 22.6% |
| 45 | Delaware | $75,000 | $7,670 | $5,738 | $3,609 | $57,984 | $4,832 | $2,230 | 22.7% |
| 46 | California | $75,000 | $7,670 | $5,738 | $2,775 | $57,843 | $4,820 | $2,225 | 22.9% |
| 47 | Massachusetts | $75,000 | $7,670 | $5,738 | $3,530 | $57,718 | $4,810 | $2,220 | 23.0% |
| 48 | Maine | $75,000 | $7,670 | $5,738 | $3,881 | $57,712 | $4,809 | $2,220 | 23.1% |
| 49 | Hawaii | $75,000 | $7,670 | $5,738 | $4,170 | $57,423 | $4,785 | $2,209 | 23.4% |
| 50 | Oregon | $75,000 | $7,670 | $5,738 | $5,062 | $56,531 | $4,711 | $2,174 | 24.6% |
$100,000 salary ranking
Scroll horizontally for all columns. Activate a column heading to sort this table.
| T-1 | Alaska | $100,000 | $13,170 | $7,650 | $0 | $79,180 | $6,598 | $3,045 | 20.8% |
|---|---|---|---|---|---|---|---|---|---|
| T-1 | Florida | $100,000 | $13,170 | $7,650 | $0 | $79,180 | $6,598 | $3,045 | 20.8% |
| T-1 | Nevada | $100,000 | $13,170 | $7,650 | $0 | $79,180 | $6,598 | $3,045 | 20.8% |
| T-1 | New Hampshire | $100,000 | $13,170 | $7,650 | $0 | $79,180 | $6,598 | $3,045 | 20.8% |
| T-1 | South Dakota | $100,000 | $13,170 | $7,650 | $0 | $79,180 | $6,598 | $3,045 | 20.8% |
| T-1 | Tennessee | $100,000 | $13,170 | $7,650 | $0 | $79,180 | $6,598 | $3,045 | 20.8% |
| T-1 | Texas | $100,000 | $13,170 | $7,650 | $0 | $79,180 | $6,598 | $3,045 | 20.8% |
| T-1 | Wyoming | $100,000 | $13,170 | $7,650 | $0 | $79,180 | $6,598 | $3,045 | 20.8% |
| 9 | Washington | $100,000 | $13,170 | $7,650 | $0 | $78,600 | $6,550 | $3,023 | 21.4% |
| 10 | North Dakota | $100,000 | $13,170 | $7,650 | $691 | $78,489 | $6,541 | $3,019 | 21.5% |
| 11 | Ohio | $100,000 | $13,170 | $7,650 | $1,981 | $77,199 | $6,433 | $2,969 | 22.8% |
| 12 | Arizona | $100,000 | $13,170 | $7,650 | $2,291 | $76,889 | $6,407 | $2,957 | 23.1% |
| 13 | Louisiana | $100,000 | $13,170 | $7,650 | $2,614 | $76,566 | $6,381 | $2,945 | 23.4% |
| 14 | Indiana | $100,000 | $13,170 | $7,650 | $2,921 | $76,260 | $6,355 | $2,933 | 23.7% |
| 15 | Pennsylvania | $100,000 | $13,170 | $7,650 | $3,070 | $76,110 | $6,343 | $2,927 | 23.9% |
| 16 | Rhode Island | $100,000 | $13,170 | $7,650 | $3,148 | $76,032 | $6,336 | $2,924 | 24.0% |
| 17 | Iowa | $100,000 | $13,170 | $7,650 | $3,148 | $76,032 | $6,336 | $2,924 | 24.0% |
| 18 | Mississippi | $100,000 | $13,170 | $7,650 | $3,268 | $75,912 | $6,326 | $2,920 | 24.1% |
| 19 | Kentucky | $100,000 | $13,170 | $7,650 | $3,382 | $75,798 | $6,316 | $2,915 | 24.2% |
| 20 | South Carolina | $100,000 | $13,170 | $7,650 | $3,463 | $75,718 | $6,310 | $2,912 | 24.3% |
| 21 | North Carolina | $100,000 | $13,170 | $7,650 | $3,481 | $75,699 | $6,308 | $2,911 | 24.3% |
| 22 | New Mexico | $100,000 | $13,170 | $7,650 | $3,569 | $75,611 | $6,301 | $2,908 | 24.4% |
| 23 | Nebraska | $100,000 | $13,170 | $7,650 | $3,670 | $75,510 | $6,292 | $2,904 | 24.5% |
| 24 | Arkansas | $100,000 | $13,170 | $7,650 | $3,687 | $75,493 | $6,291 | $2,904 | 24.5% |
| 25 | West Virginia | $100,000 | $13,170 | $7,650 | $3,691 | $75,489 | $6,291 | $2,903 | 24.5% |
| 26 | Colorado | $100,000 | $13,170 | $7,650 | $3,692 | $75,488 | $6,291 | $2,903 | 24.5% |
| 27 | Missouri | $100,000 | $13,170 | $7,650 | $3,763 | $75,417 | $6,285 | $2,901 | 24.6% |
| 28 | Oklahoma | $100,000 | $13,170 | $7,650 | $3,955 | $75,226 | $6,269 | $2,893 | 24.8% |
| 29 | Michigan | $100,000 | $13,170 | $7,650 | $3,999 | $75,181 | $6,265 | $2,892 | 24.8% |
| 30 | Alabama | $100,000 | $13,170 | $7,650 | $4,102 | $75,079 | $6,257 | $2,888 | 24.9% |
| 31 | Vermont | $100,000 | $13,170 | $7,650 | $4,140 | $75,040 | $6,253 | $2,886 | 25.0% |
| 32 | New Jersey | $100,000 | $13,170 | $7,650 | $4,180 | $75,000 | $6,250 | $2,885 | 25.0% |
| 33 | Idaho | $100,000 | $13,170 | $7,650 | $4,192 | $74,988 | $6,249 | $2,884 | 25.0% |
| 34 | Montana | $100,000 | $13,170 | $7,650 | $4,289 | $74,891 | $6,241 | $2,880 | 25.1% |
| 35 | Maryland | $100,000 | $13,170 | $7,650 | $4,386 | $74,794 | $6,233 | $2,877 | 25.2% |
| 36 | Wisconsin | $100,000 | $13,170 | $7,650 | $4,428 | $74,752 | $6,229 | $2,875 | 25.2% |
| 37 | Utah | $100,000 | $13,170 | $7,650 | $4,450 | $74,730 | $6,228 | $2,874 | 25.3% |
| 38 | Georgia | $100,000 | $13,170 | $7,650 | $4,567 | $74,613 | $6,218 | $2,870 | 25.4% |
| 39 | Connecticut | $100,000 | $13,170 | $7,650 | $4,750 | $74,430 | $6,203 | $2,863 | 25.6% |
| 40 | Kansas | $100,000 | $13,170 | $7,650 | $4,780 | $74,400 | $6,200 | $2,862 | 25.6% |
| 41 | Illinois | $100,000 | $13,170 | $7,650 | $4,805 | $74,375 | $6,198 | $2,861 | 25.6% |
| 42 | New York | $100,000 | $13,170 | $7,650 | $4,860 | $74,320 | $6,193 | $2,858 | 25.7% |
| 43 | Virginia | $100,000 | $13,170 | $7,650 | $4,936 | $74,244 | $6,187 | $2,856 | 25.8% |
| 44 | Massachusetts | $100,000 | $13,170 | $7,650 | $4,780 | $73,940 | $6,162 | $2,844 | 26.1% |
| 45 | Delaware | $100,000 | $13,170 | $7,650 | $5,259 | $73,921 | $6,160 | $2,843 | 26.1% |
| 46 | Minnesota | $100,000 | $13,170 | $7,650 | $5,277 | $73,903 | $6,159 | $2,842 | 26.1% |
| 47 | Maine | $100,000 | $13,170 | $7,650 | $5,654 | $73,526 | $6,127 | $2,828 | 26.5% |
| 48 | Hawaii | $100,000 | $13,170 | $7,650 | $6,070 | $73,110 | $6,093 | $2,812 | 26.9% |
| 49 | California | $100,000 | $13,170 | $7,650 | $5,055 | $72,825 | $6,069 | $2,801 | 27.2% |
| 50 | Oregon | $100,000 | $13,170 | $7,650 | $7,177 | $72,003 | $6,000 | $2,769 | 28.0% |
Charts
Downloadable SVG charts use the same final dataset as the table and CSV.
How to interpret the comparison
The comparison isolates a consistent wage-and-tax scenario. It is useful for seeing how modeled state tax treatment changes the same gross salary, but it is not a cost-of-living ranking and does not say where a person is better off. Housing, insurance, sales and property taxes, benefits, local taxes, credits, and household circumstances remain outside this table.
Methodology
Scenario. One wage earner filing single, no dependents, standard deduction, no itemized deductions, no pre-tax benefits, and no other income. Gross wages are modeled at $50,000, $75,000, and $100,000.
Federal income tax. Gross wages minus the 2026 single standard deduction of $16,100 are passed through the seven federal ordinary-income brackets. Credits and special deductions are not modeled.
Payroll taxes. Employee Social Security is 6.2% up to the 2026 $184,500 wage base and Medicare is 1.45%. All modeled salaries remain below both the Social Security wage base and the Additional Medicare threshold.
State income tax. Each jurisdiction uses the same marginal-bracket engine with its published single-filer deduction, exemption, or stated credit. Explicit adjustments cover Alabama's deduction floor, Arkansas's lower-income schedule, California's 2026 estimated-tax reference amounts, Connecticut's exemption phaseout, Ohio's exemption bands, South Carolina's H. 4216 rates and $15,000 adjusted deduction, Utah's 4.45% rate and credit phaseout, West Virginia's retroactive rate cut, and Wisconsin's deduction phaseout.
Other modeled payroll taxes. California SDI at 1.3%, the maximum Massachusetts employee PFML share at 0.46%, and WA Cares at 0.58% are included. Massachusetts employers may cover some or all of the employee share, so that row is a conservative baseline. Other state leave, disability, unemployment, transit, occupational, and city payroll programs are not comprehensively modeled.
Rounding. Component taxes and take-home amounts are rounded to cents after each annual calculation. Monthly values divide annual take-home by 12; biweekly values divide by 26. Rankings sort by unrounded-equivalent cent values, then state name for a deterministic display. Equal take-home values are labeled as ties.
Update process. Refresh the federal, payroll, state, and state-payroll inputs; run the calculation tests; regenerate the table, findings, charts, source notes, and CSV from the shared engine; then advance the visible update date only for a substantive data or methodology change.
Sources
The federal and payroll inputs use primary IRS and SSA publications. State parameters begin with the cited 2026 workbook, which compiles state statutes, forms, and instructions; later official guidance directly overrides or supplements the workbook for California, Indiana, New York, Texas, Florida, Oregon, Utah, South Carolina, and West Virginia. Massachusetts payroll treatment uses direct state guidance.
- Internal Revenue Service: Revenue Procedure 2025-32, 2026 inflation-adjusted tax items. Single-filer federal income-tax brackets and $16,100 standard deduction Accessed 2026-08-20. The model applies the ordinary-income rate schedule to wages after the standard deduction. It does not model credits or special deductions.
- Internal Revenue Service: Publication 15 (2026), Employer's Tax Guide. Employee Medicare rate of 1.45 percent and Additional Medicare threshold Accessed 2026-08-20. The modeled salaries remain below the $200,000 Additional Medicare withholding threshold.
- Social Security Administration: Contribution and Benefit Base. Employee Social Security rate of 6.2 percent and $184,500 wage base Accessed 2026-08-20. All three modeled salaries are below the 2026 wage base.
- Tax Foundation: 2026 State Individual Income Tax Rates and Brackets workbook. State rates, brackets, standard deductions, exemptions, credits, and limitation flags for 50 states and Washington, D.C. Accessed 2026-08-20. The workbook states that it compiles state statutes, forms, and instructions as of February 11, 2026. The model preserves its explicit provisional-year notes and documents simplified treatments below.
- Indiana Department of Revenue: Rates, Fees and Penalties. Indiana individual adjusted gross income tax rate of 2.95 percent Accessed 2026-08-20. County income taxes are explicitly excluded from the state-level model.
- California Franchise Tax Board: 2026 Instructions for Form 540-ES. 2026 estimated-tax method using the latest published California rate schedule, standard deduction, and exemption credit Accessed 2026-08-20. The 2026 estimated-tax instructions point taxpayers to the 2025 Form 540 amounts. The model therefore uses the official $5,706 single standard deduction and $153 personal exemption credit until final 2026 return instructions are available.
- New York State Department of Taxation and Finance: Instructions for Form IT-2106, 2026 estimated income tax. 2026 New York State single-filer tax schedule Accessed 2026-08-20. New York City and Yonkers income taxes are local taxes and are excluded.
- Texas Comptroller of Public Accounts: Income tax - no personal income tax in Texas. No Texas personal income tax on wage income Accessed 2026-08-20. Federal income and payroll taxes still apply.
- Florida Department of Revenue: Do I have to file a personal income tax return in Florida?. No Florida personal income tax on wage income Accessed 2026-08-20. Federal income and payroll taxes still apply.
- Utah State Tax Commission: Publication 14, Utah Withholding Information and Tax Tables, effective June 1, 2026. Utah individual income tax rate of 4.45 percent Accessed 2026-08-20. The rate change supersedes the 4.5 percent value in the February state-rate workbook and is retroactive for tax year 2026.
- South Carolina Department of Revenue: Information about H. 4216. 1.99 and 5.21 percent rates and $15,000 single South Carolina Income Adjusted Deduction Accessed 2026-08-20. The change applies beginning with tax year 2026 and supersedes the February state-rate workbook.
- West Virginia Tax Division: 2026 Income Tax Rate Cut. Retroactive 2026 personal income tax brackets from 2.11 to 4.58 percent Accessed 2026-08-20. Signed March 31, 2026 and retroactive to January 1, 2026; supersedes the February state-rate workbook.
- Massachusetts Department of Family and Medical Leave: Paid Family and Medical Leave employer contribution rates and calculator. Maximum employee PFML withholding of 0.46 percent of eligible wages Accessed 2026-08-20. Employers may cover some or all of the employee share; the model uses the maximum employee withholding as a conservative baseline.
- Oregon Department of Revenue: 2026 Oregon Withholding Tax Formulas. Federal income tax liability subtraction, capped at $8,500 for single filers below $125,000 Accessed 2026-08-20. The study's three salaries are within the full-subtraction AGI band; the modeled deduction is the smaller of federal income tax liability or $8,500.
Limitations
- Local taxes are excluded. This is material in parts of Alabama, California, Colorado, Delaware, Indiana, Iowa, Kansas, Kentucky, Maryland, Michigan, Missouri, New Jersey, New York, Ohio, Oregon, Pennsylvania, and West Virginia. New York City, Yonkers, Maryland counties, Indiana counties, and many Ohio and Pennsylvania municipalities can materially reduce actual take-home.
- The model estimates annual tax liability under one baseline, not exact withholding on a particular paycheck.
- It does not model tax credits, earned income credits, retirement or health deductions, itemized deductions, bonuses, tips, overtime exclusions, multiple jobs, spouse income, dependents, residency changes, reciprocity, or non-wage income.
- Missouri's income-dependent federal-tax deduction details are not modeled; this can make its state-tax estimate conservative. Connecticut's income-based personal tax credit is also excluded.
- Some deduction, exemption, and bracket amounts were still provisional in the February workbook. California uses the official prior-year amounts referenced by its 2026 estimated-tax instructions, while later official Utah, South Carolina, and West Virginia changes override the workbook.
- Cost of living, sales tax, property tax, insurance, benefits, and public services are outside the ranking.
This study is an estimate and is not personalized tax advice. Use current official instructions or a qualified tax professional for an actual return or withholding decision.
Download the data
The CSV contains every displayed state and D.C. calculation for all three salaries, including the component taxes, assumptions, dataset version, and local-tax flag.
Cite this resource
EverydayCalc.org. “2026 Take-Home Pay by State: Compare $50K, $75K and $100K Salaries.” Dataset take-home-pay-state-2026.3, published and updated August 20, 2026. https://everydaycalc.org/research/take-home-pay-by-state/