Finance chart
Mortgage Payment Chart
Use this mortgage payment chart to compare sample loan amounts, rates, and monthly principal-and-interest payments. Use the chart as a quick planning reference, then use Mortgage Payment Calculator when you need exact numbers for your own inputs.
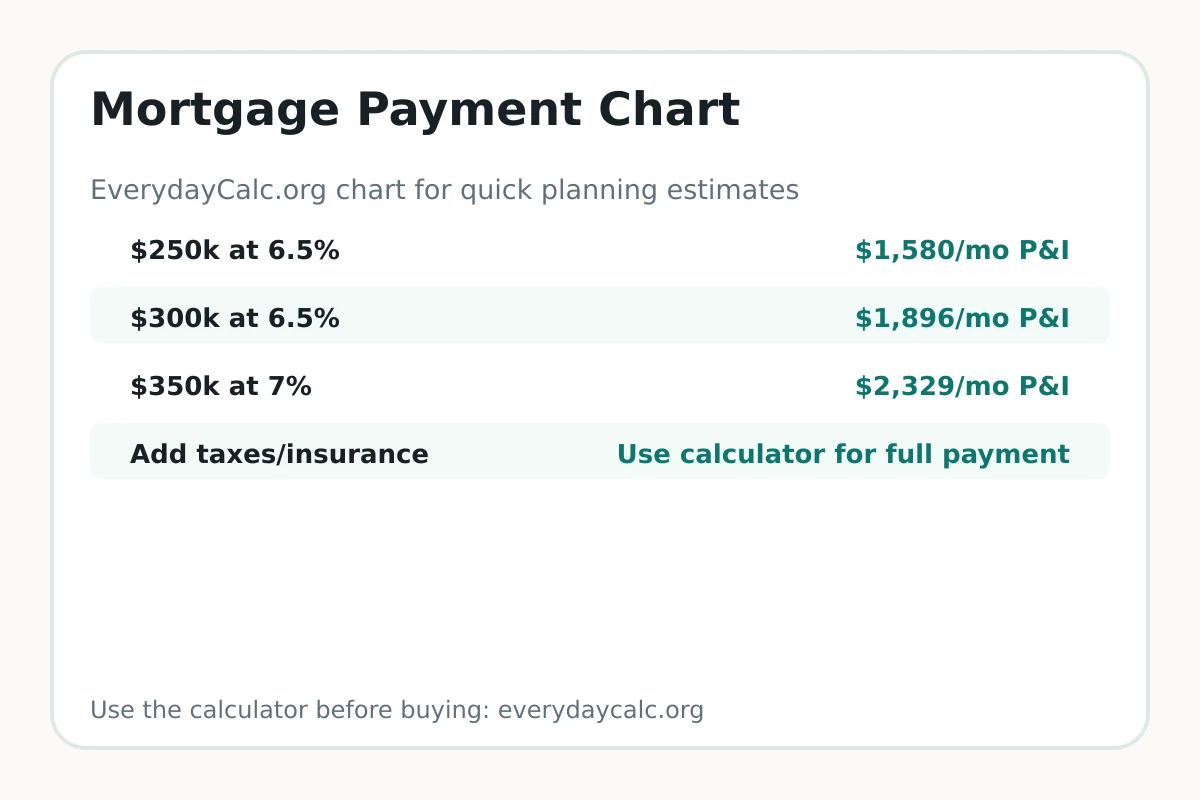
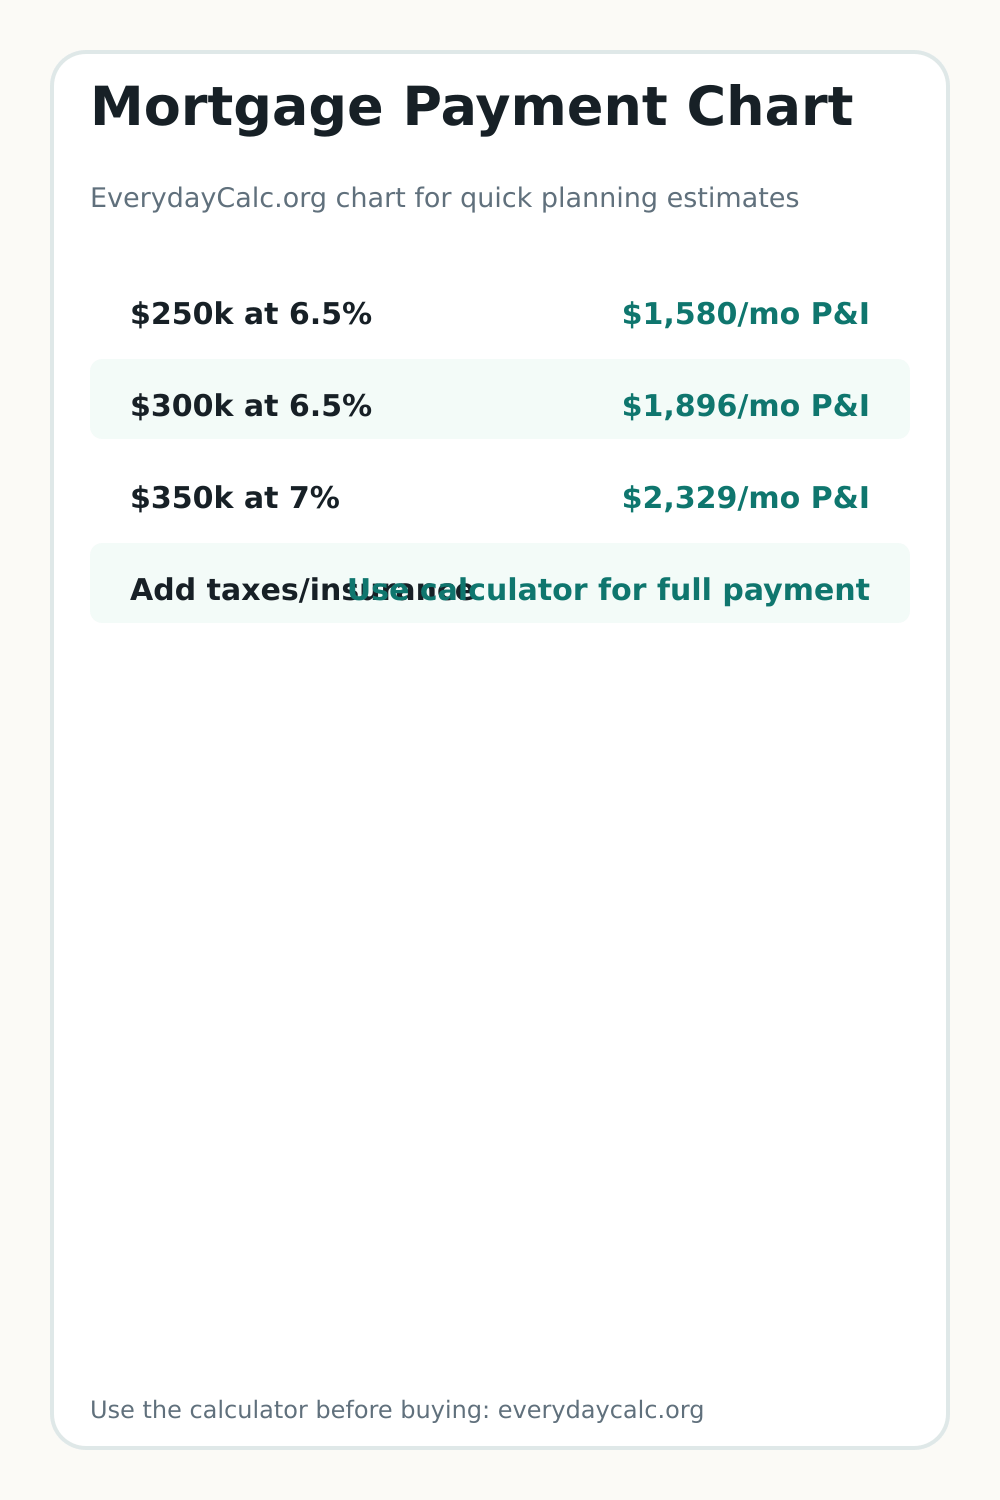
Chart values
| Estimate | Chart value |
|---|---|
| $250k at 6.5% | $1,580/mo P&I |
| $300k at 6.5% | $1,896/mo P&I |
| $350k at 7% | $2,329/mo P&I |
| Add taxes/insurance | Use calculator for full payment |
How to use this chart
- Find the row closest to your room, tank, project, payment, or classroom planning situation.
- Use the value as a starting estimate, not a final recommendation.
- Check the assumptions in the table and image before sharing or printing.
- Open the related calculator when your inputs differ from the chart example.
When to use the calculator instead
Use the calculator when your measurements, rates, room conditions, local prices, tank setup, loan terms, or classroom routine do not match the simple chart rows. The calculator lets you adjust the inputs instead of forcing your situation into a rough example.
Examples from this chart
Worked example
- $250k at 6.5%: use $1,580/mo P&I as the quick chart estimate, then adjust the exact inputs in the calculator if your setup is different.
- $300k at 6.5%: use $1,896/mo P&I as the quick chart estimate, then adjust the exact inputs in the calculator if your setup is different.
- $350k at 7%: use $2,329/mo P&I as the quick chart estimate, then adjust the exact inputs in the calculator if your setup is different.
Limitations and assumptions
These chart rows are rounded planning estimates. Check real product labels, local rates, room conditions, tank setup, project measurements, and current prices before buying or making a final decision.
Save or share this chart
You can print this page, save the tall image for planning, or link to the page from a blog post, classroom resource, forum answer, or project checklist so readers can open the calculator too.
Chart questions
Chart questions
Should I use the mortgage payment chart or the calculator?
Use the chart for a quick planning estimate. Use the calculator when your measurements, rate, conditions, or setup differ from the chart rows.
Are chart values exact?
No. Chart values are rounded planning estimates and should be checked against the calculator and real product, project, or local conditions before you buy.